Mon - Sat 9.00 - 18.00

Sunday Closed

Call Us

+1 858 329 0211

Process Capability Study: What It Is and How to Run It (Step-by-Step)

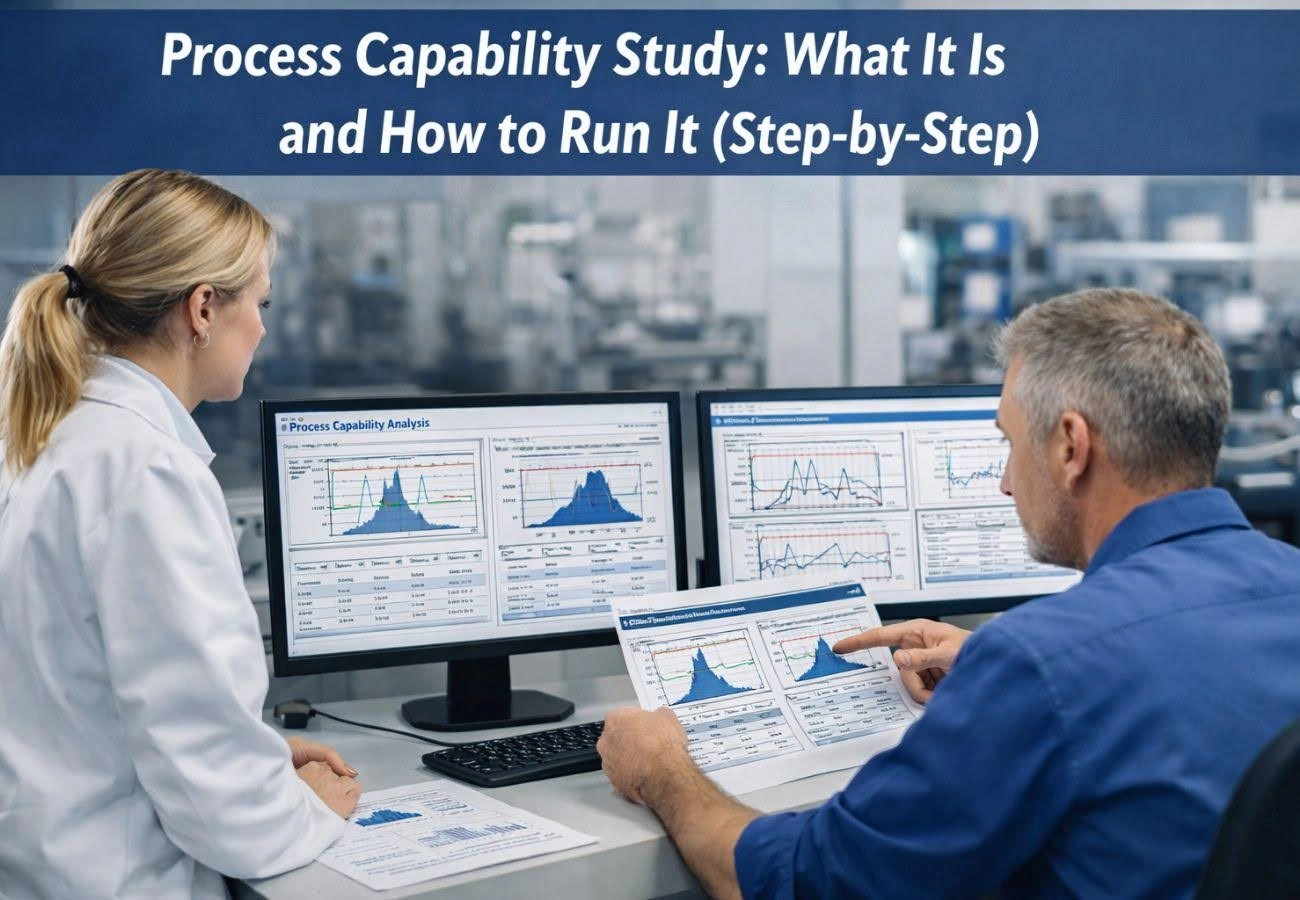
By AMREP | Posted on December 25, 2025

A process capability study is one of the most powerful tools in quality management. It statistically evaluates whether a process can consistently meet customer specifications by comparing process variation to defined limits. It involves defining the process and CTQ, validating the measurement system, collecting stable data, assessing data distribution, and calculating capability indices such as Cp and Cpk to determine how well the process performs relative to upper and lower specification limits.

This guide explains what a process capability study is, how to perform it, and how to interpret the results correctly.

This Image Depicts Process Capability Study

What Is a Process Capability Study?

A process capability study is a statistical analysis used to determine how well a process can meet defined specification limits. It compares the natural variation of a process to the customer’s requirements.

In simple terms:

  • The process generates output with variation.
  • The customer defines acceptable limits (specifications).
  • A capability study tells you how much of the process output falls within those limits.

If most of the output is within specifications, the process is considered capable. If not, the process poses a quality risk.

Process capability studies are essential because they quantify defect risk, translate process performance into business terms, support audits and compliance, guide improvement priorities, and provide objective evidence for decision-making.

What a Capability Study Is Not

  • It is not a control chart (though control charts are a prerequisite).
  • It is not a one-time report for management.
  • It is not valid for unstable or poorly measured processes.

Process Capability vs. Process Performance

One of the most common sources of confusion is the difference between process capability and process performance.

Process Capability

  • Assumes the process is stable
  • Focuses on short-term variation
  • Uses Cp and Cpk
  • Answers: What is the best the process can do?

Process Performance

  • Includes all variations over time
  • Uses Pp and Ppk
  • Answers: What has the process actually done?

Both are useful, but they answer different questions. Capability is predictive; performance is descriptive.

Prerequisites for a Valid Process Capability Study

Before running any capability analysis, three critical conditions must be met.

1. The Process Must Be Stable

A stable process is in statistical control, meaning:

  • Variation is consistent over time
  • No special causes are present
  • The process is predictable

This is verified using control charts (e.g., I-MR, X̄-R, X̄-S).

Running a capability study on an unstable process produces meaningless results.

2. The Measurement System Must Be Adequate

If your measurement system is inaccurate or inconsistent, capability results will be distorted.

Key questions:

  • Is measurement variation small relative to process variation?
  • Has a Gage R&R study been performed?
  • Are measurements repeatable and reproducible?

A general rule: measurement variation should be less then 10% of total variation.

3. Specification Limits Must Be Defined

Capability compares process output to specifications, not control limits.

  • USL: Upper Specification Limit
  • LSL: Lower Specification Limit

Specifications come from customers, engineering drawings, regulations, or contracts, not from the data itself.

Step-by-Step: How to Run a Process Capability Study

A process capability study is only meaningful when it is built on good inputs: clear specifications, reliable measurements, and a stable process. The steps below walk you through a practical, shop-floor-friendly approach that works whether you’re using Minitab, JMP, Excel, or another statistical tool.

Step 1: Define the Process, Output, and CTQ

Start by being specific about what you’re studying.

Clarify:

  • Process scope: Where does the process start and end?
  • Output metric: What exactly are you measuring (diameter, weight, fill volume, cycle time, torque, response time, etc.)?
  • CTQ (Critical-to-Quality): The measurable characteristic that matters to the customer.
  • Unit and method: Measurement units and how measurements will be taken.

Confirm specification limits:

  • USL (Upper Specification Limit)
  • LSL (Lower Specification Limit)
  • Any special rules: one-sided specs (only USL or only LSL), target value, or engineering notes.

Good practice: Write the CTQ definition in one line, for example:

“Shaft diameter at final inspection measured in mm with a micrometer; specs: LSL 19.95, USL 20.05.”

Step 2: Validate the Measurement System (MSA / Gage R&R)

Capability results are only as trustworthy as your data. If the measurement system is noisy, your standard deviation inflates, and capability indices drop, even if the process is fine.

Check basics first:
  • Calibration status
  • Proper use of instruments (fixtures, force, technique)
  • Clear measurement instructions (where/how to measure)

Run MSA when appropriate:

  • Gage R&R (Repeatability & Reproducibility) for variable data
  • Attribute agreement analysis for pass/fail inspection

What you want to see (rule of thumb):

  • Measurement system variation ideally less then 10%of total variation
  • 10–30% may be usable depending on risk/cost
  • 30% usually means fix measurement before the capability

Common issue: Different operators measure differently (technique, pressure, part orientation). Fix with training, fixtures, or better gaging.

Step 3: Plan Your Sampling Strategy

A capability study needs data that represents normal operating conditions.

Decide:

  • Rational subgrouping (if using X̄-R / X̄-S charts): e.g., 5 parts every hour
  • Individuals data (I-MR chart): one part at a time in order

Collect data across sources of variation, such as:

  • Multiple shifts
  • Different operators
  • Different machines/tools/cavities (if relevant)
  • Material lots
  • Warm-up vs steady-state conditions

Sample size guidance:

  • Minimum: ~25–30 observations (basic view)
  • Better: 50–100+ (more reliable estimates)
  • For subgroup studies, often 20–25 subgroups are a solid starting point

Avoid these traps:

  • Only collecting “good” parts
  • Sampling from a single hour/shift
  • Mixing different process conditions without labeling (e.g., combining two machines)

Step 4: Collect Data in Time Order (and Record Context)

Record measurements in the sequence produced. Capability is not just about numbers; it is about whether the process behaves consistently over time.

Capture context along with the measurement, such as:

  • Date/time
  • Machine/line
  • Operator
  • Tool number/cavity
  • Material lot
  • Settings (if relevant)

This makes it much easier to explain instability or poor capability later.

Step 5: Verify Process Stability (Control Charts First)

This is the gatekeeper step. If the process is unstable, capability indices are not reliable.

Choose the right chart:

  • I-MR (Individuals–Moving Range): when you have single measurements in time order
  • X̄-R: subgroup size typically 2–10
  • X̄-S: subgroup size typically ≥10

What you are looking for:

  • No points outside control limits
  • No non-random patterns (runs, trends, cycles)
  • Consistent variation over time

If the process is NOT stable:

  • Investigate special causes (tool wear, adjustment, material change, operator method, environment)
  • Correct the causes and standardize the fix
  • Re-collect data after the process is brought under control

Capability is meaningful only when the process is predictable.

Step 6: Check the Distribution (Normality / Non-Normal Data)

Many classic capability calculations assume the data is approximately normal.

How to assess:

  • Histogram (shape and tails)
  • Normal probability plot
  • Normality test (e.g., Anderson–Darling)

If the data is approximately normally distributed, proceed with normal capability.

If data is non-normal:

  • Use a transformation (commonly Box-Cox) if appropriate
  • Use non-normal capability analysis (fitting an appropriate distribution)
  • Consider whether the CTQ naturally behaves non-normal (cycle time often is right-skewed)

Warning: Don’t force normal methods on heavily skewed data—your predicted defect rates can be badly wrong.

Step 7: Calculate Capability Indices (Cp, Cpk / Pp, Ppk)

Process capability is summarized using indices. Each index provides a different perspective on process behavior.

Cp – (Process Capability Index)

Cp measures the potential capability of a process, assuming it is perfectly centered.

Formula:

Cp = USL - LSL / 6σ

Cp tells you the potential capability by comparing specification width to process variation, assuming the process is centered, but it does not indicate whether the process is actually centered or how much output is out of specification.

Cpk – (Process Capability Index – Centered),

Cpk accounts for both variation and centering.

Formula:

Cpk = min (USL - μ / 3σ , μ-LSAL / 3σ)

Cpk answers the most important question: How capable is the process right now? If Cp ≫ Cpk, the process has a centering problem.

Pp and Ppk – Long-Term Performance

  • Pp (Process Performance Index) is the performance equivalent of Cp
  • Ppk (Process Performance Index – Centered) is the performance equivalent of Cpk

They use the overall standard deviation, including long-term variation such as:

  • Shift-to-shift differences
  • Material changes
  • Environmental effects

Use Pp/Ppk when analyzing historical or long-term data.

Typical benchmarks (varies by industry):

  • ≥1.00: barely meets specs
  • ≥1.33: commonly acceptable minimum
  • ≥1.67: strong capability
  • ≥2.00: highly capable / “world-class”

Step 8: Visualize Results (Histogram + Specs + Capability Plot)

Always pair indices with visuals. They help non-statisticians understand what’s happening.

Include:

  • Histogram with LSL/USL lines
  • Capability plot (if the software provides it)
  • Summary statistics (mean, stdev)
  • Percent out of spec (observed and predicted)

Why this matters: Two processes can have the same Cpk but very different real-world risk depending on distribution shape, sample size, or stability.

Step 9: Translate Results into Practical Impact

Capability indices should lead to a decision.

Convert capability into:

  • Estimated defect rate (ppm or % out of spec)
  • Scrap/rework cost
  • Customer risk
  • Expected yield

Answer these questions:

  • Is the process capable enough for customer requirements?
  • If not, is the issue centering or variation (or both)?
  • What is the improvement priority?

Step 10: Take Corrective Action and Re-Run the Study

A capability study is often the baseline for improvement.

If capability is low, typical actions include:

If variation is the problem (Cp low):

  • Reduce sources of variation (materials, method, machine, environment)
  • Prevent tool wear and drift (maintenance, tool change strategy)
  • Standardize setups and work instructions

If centering is the problem (Cpk low but Cp ok):

  • Adjust set points
  • Improve targeting/control strategy
  • Tighten changeover and startup controls

After changes:

  • Re-check stability
  • Re-run capability with new data
  • Document before/after results

A Practical “Done Right” Checklist

Before you finalize the study, confirm:

  • Specs are correct (USL/LSL are verified)
  • Measurement system is acceptable (MSA complete or validated)
  • Data is time-ordered and representative
  • The control chart shows stability
  • Distribution method matches the data
  • Cp/Cpk or Pp/Ppk are calculated correctly
  • Results are linked to defect risk and an action plan

Example: Process Capability Study in Practice

Scenario:

A call center measures call handling time with a customer requirement of ≤ 6 minutes.

  • Mean: 5.2 minutes
  • Standard deviation: 0.6 minutes
  • USL: 6.0 minutes

Cpk calculation:

Cpk = 6.0 - 5.2 / 3 х 0.6 = 0.44

Interpretation:

  • The process is not capable
  • High risk of long calls
  • Improvement must focus on reducing variation and shifting the mean

Common Mistakes to Avoid

  1. Running capability on unstable processes
  2. Confusing control limits with specification limits
  3. Ignoring measurement system error
  4. Using too little data
  5. Relying on Cp alone
  6. Forcing normality assumptions

Avoiding these mistakes dramatically improves decision quality.

How to Improve Process Capability

Improving capability generally involves one or more of the following:

Reduce Variation

  • Standardize work
  • Improve equipment maintenance
  • Reduce material variability
  • Train operators

Center the Process

  • Adjust settings
  • Improve targeting
  • Eliminate bias

Redesign the Process

  • Change technology
  • Modify specifications
  • Remove non-value-added steps

Structured methodologies like DMAIC are ideal for capability improvement.

Tools and Software for Capability Analysis

Popular tools include:

  • Minitab – Industry-standard statistical software with built-in capability analysis, control charts, and clear graphical outputs; widely used in Six Sigma and quality engineering.
  • JMP – Interactive statistical software suited for deeper data exploration, modeling, and advanced capability analysis.
  • Excel (with caution) – Accessible for basic calculations, but limited in control charting, distribution fitting, and error prevention; requires strong statistical discipline.
  • Python/R (advanced users) – Highly flexible and powerful for customized capability analysis and automation, but requires strong programming and statistical expertise.

Process capability studies work best alongside other proven methods, learn more in our article on Quality Control Tools for Managing Your Outsourced Supply Chain.

Partner with AMREP Inspect to ensure consistent customer compliance.

When performed correctly, a process capability study provides a comprehensive, data-driven understanding of process performance, enabling organizations to reduce defects, proactively manage quality risk, and systematically prioritize process improvements.

To ensure your capability studies are built on accurate, reliable inspection data, AMREP Inspect’s quality inspection services provide the support you need. From professional inspection execution to consistent data collection and reporting, AMREP Inspect helps organizations maintain compliance, reduce variation, and make confident, data-driven quality decisions.

Don't Forget to Share This Post

Contact Us To See What We Can Do

Call Us

+1 858 329 0211

Mon - Sat 9.00 - 18.00

Sunday Closed

Get In Touch

12 - May 2025

12

May

2025

Guide to Qualifying New Suppliers in Malaysia for Manufacturing Success

Malaysia is a premier manufacturing hub in Southeast Asia. According to the Malaysian Investment Development Authority (MIDA), “Malaysia, with its extensive trade....

22 - April 2025

22

April

2025

Total Quality Management in Healthcare: Elevating Patient Care and Operational Efficiency

Healthcare is rapidly evolving, ensuring consistent and high-quality patient care. Total Quality Management (TQM) in healthcare is more than just a buzzword—it is a powerful....

16 - April 2025

16

April

2025

Principles of Total Quality Management (TQM)

Total Quality Management (TQM) is a mindset that involves everyone in the organization working toward a common goal: achieving excellence through quality. From....

Footer Banner Image