Total Quality Control
Total Quality Control (TQC) is a comprehensive approach to improving the quality of products, services, and processes within an organization. It emphasizes ...
By AMREP | Posted on April 03, 2025

Total Quality Management (TQM) is a comprehensive approach aimed at improving the quality of products and services. It involves all members of an organization in the process of continuous improvement. TQM relies on a collection of powerful tools designed to enhance decision- making, streamline processes, and solve complex problems effectively.
In this blog, we will explore some of the essential TQM tools that businesses use to maintain high-quality standards.
Total Quality Management (TQM) tools are various techniques and methodologies used by organizations to improve quality, increase efficiency, and ensure customer satisfaction. These tools help in identifying and addressing issues in processes, products, and services to achieve continuous improvement.
Some common TQM tools are:
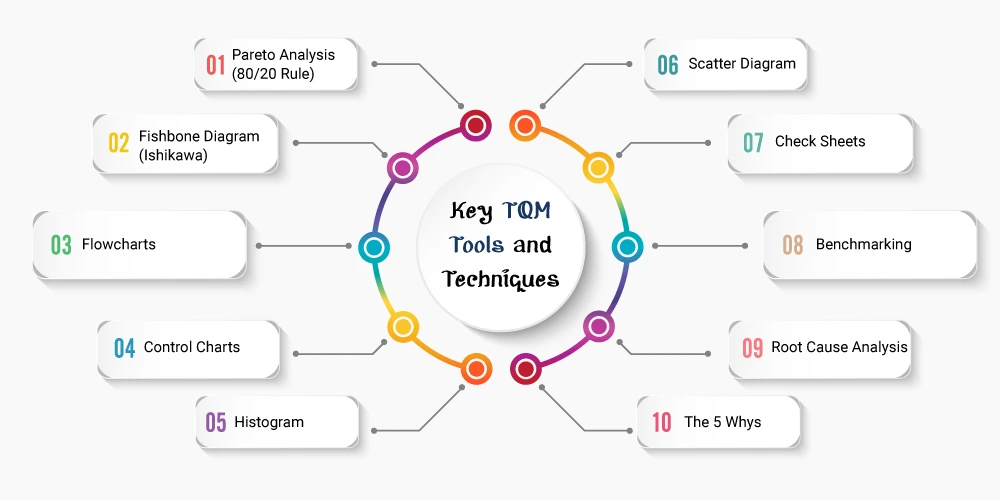
Pareto Analysis helps businesses identify the most significant issues that need attention. It’s based on the 80/20 rule, which states that 80% of problems come from 20% of the causes. By using this tool, companies can focus on the key areas that will have the greatest impact on quality.
The Fishbone Diagram is a visual tool used to identify the root causes of a problem. It resembles a fish’s skeleton and helps teams organize potential causes into categories like People, Process, Equipment, and Materials. It is effective in solving complex issues and improving quality.
Flowcharts are diagrams that depict the steps in a process. They help identify bottlenecks, inefficiencies, and areas for improvement. By visualizing the process, teams can easily spot issues and work on improving workflow, making it a valuable tool for quality management.
Control Charts are used to monitor a process over time and assess its stability. They display data points in a graphical format, helping teams identify any variations or trends. By recognizing these variations, businesses can take corrective action before a problem escalates.
A Histogram is a bar chart that shows the frequency distribution of a set of data. It provides insights into how data points are spread and helps identify patterns or anomalies in the process. This tool is essential for quality control and process improvement.
A Scatter Diagram is used to determine the relationship between two variables. It is a helpful tool in identifying correlations between factors that affect product quality. By plotting data points, teams can visualize trends and make data-driven decisions.
Check Sheets are simple tools used to collect and organize data in real-time. They are particularly useful for recording issues or defects during production. By keeping track of recurring problems, businesses can implement solutions to reduce defects and improve quality.
Benchmarking is the practice of comparing business processes and performance metrics to industry standards or best practices. This helps organizations understand where they stand and identify areas for improvement. It’s a crucial tool for staying competitive and achieving excellence.
Root Cause Analysis (RCA) is a problem-solving tool used to identify the underlying causes of an issue. By investigating the root cause, businesses can implement long-term solutions rather than just addressing the symptoms. RCA helps ensure continuous improvement in processes and product quality.
The 5 Whys is a simple but effective problem-solving technique. It involves asking "Why?" five times to get to the root cause of a problem. This tool is valuable for teams who need to quickly identify issues and implement solutions without complicated analysis.
| Type of TQM Tool | Tool | Purpose/Description |
|---|---|---|
| Basic TQM Tools | Check Sheets | Used to collect and organize data to identify patterns or trends in a process. |
| Pareto Charts | A bar chart that helps prioritize issues, based on the Pareto principle (80/20 rule), showing the most common causes of problems. | |
| Cause-and-Effect Diagrams (Fishbone/Ishikawa) | Visual tool to identify the root causes of a problem by mapping out various potential factors. | |
| Histograms | A graphical representation of data distribution to understand the frequency of different data points. | |
| Scatter Diagrams | Used to show the relationship between two variables to identify trends or correlations. | |
| Control Charts | Monitors process consistency and stability over time to identify any deviations or irregularities. | |
| Flowcharts | Diagrams that map out processes to identify inefficiencies or bottlenecks. | |
| Advanced TQM Tools | Six Sigma Tools (DMAIC) | A structured problem-solving methodology (Define, Measure, Analyze, Improve, Control) aimed at improving quality and reducing defects. |
| Statistical Process Control (SPC) | Uses statistical methods to monitor and control processes, ensuring minimal variation and maximum performance. | |
| Lean Tools (e.g., 5S, VSM) | Lean focuses on eliminating waste and optimizing processes. Includes tools like 5S (organize the workspace) and Value Stream Mapping (VSM) (to identify inefficiencies). | |
| Failure Mode and Effect Analysis (FMEA) | Identifies potential failures in processes/products and prioritizes them based on severity, likelihood, and detectability. | |
| Total Productive Maintenance (TPM) | Maximizes equipment effectiveness by involving everyone in the organization in maintenance and breakdown prevention. | |
| Problem-Solving Tools | Root Cause Analysis (RCA) | Identifies the root cause of an issue to prevent recurrence and ensure complete resolution. |
| Brainstorming | A group technique to generate ideas for problem-solving or process improvement. | |
| Customer-Focused Tools | Voice of the Customer (VOC) | Captures customer feedback, preferences, and expectations to align products/services with customer needs. |
| Customer Satisfaction Surveys | Collects direct feedback from customers about their experiences to help improve products/services. |
Read More: Total Quality Management Vs Six Sigma
Implementing Total Quality Management (TQM) requires dedication from top leadership and active involvement from every employee. Establishing a culture centered on quality is key, where everyone is aligned on continuous improvement and customer satisfaction. Essential elements for successful TQM implementation include:
When implemented successfully, TQM can lead to significant improvements in overall performance, customer satisfaction, and provide a competitive edge in the market.
TQM implementation typically unfolds in five key stages:
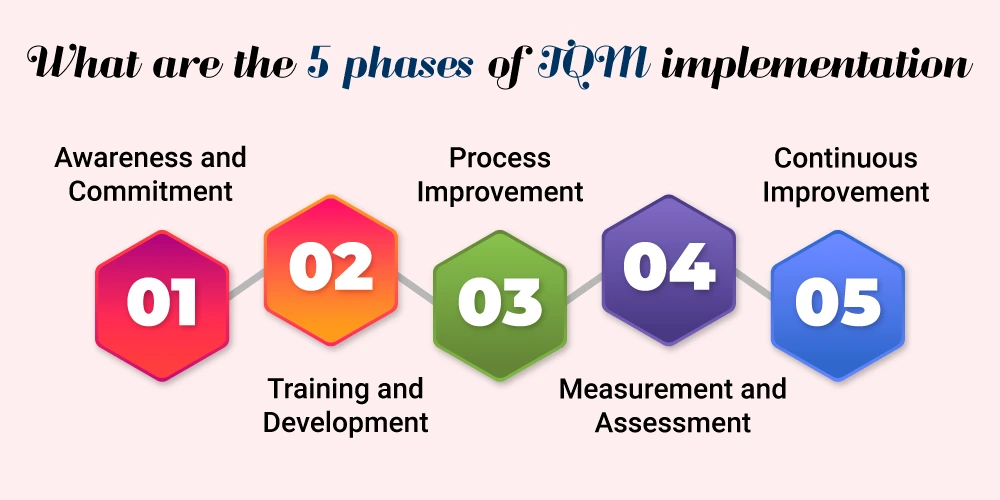
This initial phase is about building awareness of TQM principles and securing commitment from leadership and employees. It’s crucial to clearly communicate the importance of quality across all levels and develop a shared vision.
Once there is commitment, organizations should provide in-depth training on TQM principles, tools, and techniques. This ensures that employees have the knowledge and skills to effectively contribute to quality improvement efforts.
In this phase, the focus shifts to identifying key processes that need improvement. Tools like process mapping, value stream mapping, and Six Sigma are applied to streamline workflows, reduce waste, and eliminate inefficiencies.
To track progress and ensure continuous enhancement, organizations need to establish a strong measurement system. By gathering data on important performance indicators (KPIs) such as quality, customer satisfaction, and process efficiency, organizations can monitor improvements and make informed decisions.
The final phase is about making a long-term commitment to improvement. Organizations should regularly evaluate their processes, identify areas for further enhancement, and take corrective actions. This phase emphasizes learning from experiences, adjusting to changes, and consistently striving for better quality.
TQM becomes a continuous journey of improvement, helping organizations enhance quality and achieve sustained success.
Must see: Effective TQM Practices and Strategies for Business Success
Total Quality Management (TQM) is a management approach focused on improving the quality of products and services by involving all members of an organization. It aims for continuous improvement, customer satisfaction, and the effective use of resources.
TQM tools are crucial because they help businesses identify problems, analyze processes, and implement improvements. Using these tools leads to better decision-making, reduced defects, and higher customer satisfaction.
Pareto Analysis is a technique based on the 80/20 rule, which suggests that 80% of problems are caused by 20% of the issues. In TQM, it helps organizations focus on the most critical problems that will provide the greatest improvement when solved.
The Fishbone Diagram helps identify the root causes of a problem by visually categorizing potential causes into groups like people, processes, and materials. It helps teams address issues at their source, preventing recurring problems.
Flowcharts visually represent the steps in a process. They help businesses identify inefficiencies, bottlenecks, or redundancies in workflows, allowing them to optimize processes for better quality and efficiency.
A histogram is a bar chart that displays the distribution of data. In TQM, histograms help businesses identify patterns or anomalies in processes, providing valuable insights for data-driven decision-making and quality improvement.
Check Sheets are simple tools for collecting and organizing data during production or operations. They help track defects or issues and make it easier to identify trends that need corrective action.
Yes, TQM tools can be implemented by businesses of all sizes. While large organizations often use these tools extensively, small businesses can also benefit from using simple TQM techniques to improve their processes and quality.
To start implementing TQM tools, first, ensure that all team members are trained and understand the tools. Begin by identifying key areas for improvement and select relevant tools (like Pareto Analysis or Fishbone Diagrams) to address those areas. Continuous monitoring and adaptation are essential for success.
Most TQM tools are simple, low-cost techniques that require minimal investment in terms of software or equipment. The main cost comes from training staff and dedicating time to use the tools effectively.
TQM tools help businesses identify and solve problems in their processes, leading to fewer defects, higher quality products, and better service. All of these contribute to improved customer satisfaction and loyalty.
Incorporating the right TQM tools can significantly enhance your organization’s efficiency, improve quality, and boost customer satisfaction. At AMREP, we're manufacturing and engineering specialists who understand that continuous improvement is the key to sustained success. By embracing these tools, you can not only solve existing problems but also create a culture of quality that drives long-term growth. Ready to take the next step in your quality journey? Let AMREP guide you toward operational excellence.
Contact Us To See What We Can Do
Call Us
Mon - Sat 9.00 - 18.00
Sunday Closed

18 - March 2025
18
March
2025
Total Quality Control (TQC) is a comprehensive approach to improving the quality of products, services, and processes within an organization. It emphasizes ...
12 - March 2025
12
March
2025
The success of an organization is closely tied to the effectiveness of its continuous improvement (CI) efforts. Total Quality Management (TQM) and Six Sigma ...

05 - March 2025
05
March
2025
Quality inspectors are employed across all manufacturing industries to carefully examine finished products for defects such as scratches ...


Our website uses cookies to improve your experience. Read our Cookie Policy for more information.