Guide to Qualifying New Suppliers in Malaysia for Manufacturing Success
Malaysia is a premier manufacturing hub in Southeast Asia. According to the Malaysian Investment Development Authority (MIDA), “Malaysia, with its extensive trade....

By AMREP | Posted on October 16, 2026
The cost of poor quality (COPQ) is the total cost a business absorbs because its products or processes fail to meet requirements. It is calculated as internal failure costs plus external failure costs. Internal failures are defects caught before delivery, such as scrap and rework. External failures are defects that reach the customer, such as warranty claims, returns, and recalls.
COPQ matters because these costs are rarely in one place. Scrap sits in production variances, warranty in finance, expedited freight in logistics, and supplier defects in purchasing. Until someone adds them up, the true cost stays invisible.
This guide covers:
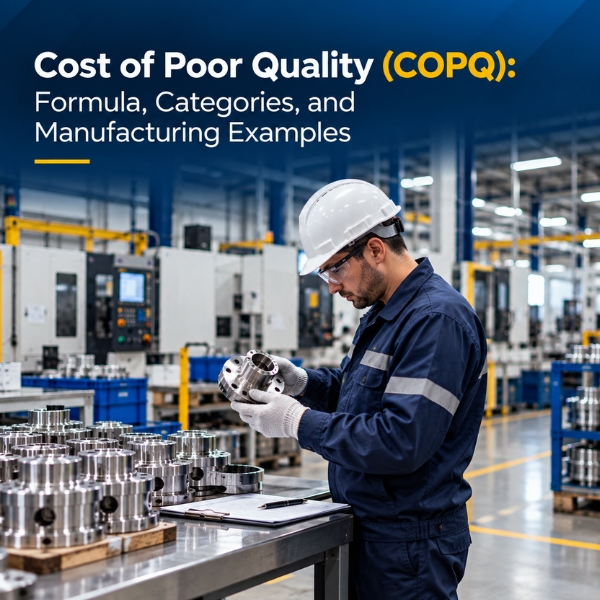
COPQ is the money lost when work is not done right the first time. It includes the material, labor, machine time, and overhead spent on defective output, plus the cost of handling defects after they leave the plant.
The concept has deep roots in quality management:
COPQ is not only a quality department metric. IATF 16949 Clause 9.3.2.1 lists the cost of poor quality, meaning the cost of internal and external nonconformance, as a required management review input for automotive suppliers. ISO 10014:2021 gives broader guidance on connecting quality management to financial and economic benefits.
The two terms are related but not interchangeable.
Cost of quality (COQ) is the total of everything spent on quality, good and bad. It splits into two halves:
| Term | What It Includes | Formula |
|---|---|---|
| Cost of Good Quality (COGQ) | Prevention + appraisal | P + A |
| Cost of Poor Quality (COPQ) | Internal failure + external failure | IF + EF |
| Total Cost of Quality (COQ) | All four categories | P + A + IF + EF |
Some organizations include appraisal in COPQ, arguing that inspection only exists because processes are not capable. Whichever definition you choose, document it and apply it consistently. A COPQ figure that changes definition between reports cannot be trended.
The prevention, appraisal, and failure (PAF) model, formalized in BS 6143-2, sorts every quality-related cost into one of four buckets.
Prevention costs are spent to stop defects before they occur. Typical examples:
Appraisal costs are spent to measure and inspect products against requirements. Typical examples:
Internal failure costs come from defects found before the product reaches the customer. Typical examples:
External failure costs come from defects found after delivery. These are usually the most expensive. Typical examples:
The relationship between categories is the key insight. Each dollar moved into prevention typically removes more than a dollar from failure. The commonly cited 1-10-100 rule captures this as a heuristic: a defect that costs 1 unit to prevent costs roughly 10 to catch internally and 100 to fix after it reaches the customer. Treat the ratio as directional rather than exact, but the pattern holds in almost every plant.
Most COPQ reports capture only the visible costs: scrap, rework, warranty. The hidden costs underneath are often larger and harder to assign.
Hidden costs include:
You don't need perfect numbers for hidden costs. Estimate them conservatively and label them as estimates. A COPQ report that admits uncertainty is more credible than one that ignores half the cost.
COPQ = Internal Failure Costs + External Failure Costs
COPQ % = (COPQ ÷ Annual Revenue) × 100
This is the most common way to benchmark COPQ over time and across sites.
Scrap Cost = Scrapped Units × Accumulated Cost per Unit at Point of Scrap
The accumulated cost is material plus all labor and overhead added up to the operation where the part was rejected. A part scrapped at the final test costs far more than one scrapped at the first machining step.
Rework Cost = (Rework Hours × Burdened Labor Rate) + Added Materials + Re-inspection Cost
Use the fully burdened labor rate, including benefits and overhead, not the base wage.
External Failure Cost = Warranty Claims + Return Processing + Chargebacks + Expedited Freight + Recall Costs
Consider an illustrative case. A plant scraps 1,200 aluminum housings at the final leak test. Each housing has $14.50 of material, machining labor, and overhead in it by that point.
Scrap cost = 1,200 × $14.50 = $17,400
Had the same defect been caught at incoming material inspection, only the raw material cost would have been lost.
The following example uses illustrative figures for a hypothetical precision machining company with $20 million in annual revenue. It shows how to build a full COPQ picture from separate cost sources.
| Cost Item | Annual Cost |
|---|---|
| Scrap (material, labor, overhead) | $310,000 |
| Rework labor and materials | $185,000 |
| Re-inspection of reworked parts | $42,000 |
| Downtime from quality holds | $96,000 |
| Total Internal Failure | $633,000 |
| Cost Item | Annual Cost |
|---|---|
| Warranty claims | $220,000 |
| Return and RMA processing | $64,000 |
| Customer chargebacks | $58,000 |
| Expedited replacement freight | $37,000 |
| Total External Failure | $379,000 |
COPQ = $633,000 + $379,000 = $1,012,000
COPQ % = ($1,012,000 ÷ $20,000,000) × 100 = 5.06% of revenue
Suppose the same company spends $140,000 on prevention and $380,000 on appraisal.
COGQ = $140,000 + $380,000 = $520,000
Total COQ = $520,000 + $1,012,000 = $1,532,000 (7.66% of revenue)
Three patterns stand out:
To test a scenario, suppose an extra $90,000 in prevention reduced scrap by one third, through process FMEA, operator training, and supplier development. Scrap would fall by about $103,000, roughly paying back the investment in year one, before counting reductions in rework, downtime, or warranty. Run this kind of what-if with your own data before committing a budget.
For companies that outsource manufacturing or buy significant components, a large share of COPQ starts at suppliers but is paid by the buyer. This is the part of COPQ that standard internal reports undercount most.
Supplier defects create costs at several points:
Many buyers recover only the part price through debit notes. The labor, downtime, freight, and customer impact stay on their own books.
To measure supplier-driven COPQ properly:
When supplier COPQ is visible by supplier, it changes sourcing conversations. A supplier with the lowest piece price can easily carry the highest total cost once failure costs are added. Catching defects at the source through on-site quality inspection services moves the detection point upstream, where every defect is cheaper to resolve.
Start with the costs you can measure reliably, then add hidden-cost estimates as your data matures. A partial COPQ figure that improves over time beats waiting for a perfect one.
Reducing COPQ means shifting spend from failure toward prevention. The most effective levers in manufacturing include:
Avoid cutting appraisal first. Removing inspection without improving process capability just moves defects from internal failure to external failure, the most expensive category.
There is no universal target, because COPQ depends on industry, product complexity, and how completely costs are captured. ASQ's rule of thumb puts COPQ at about 10% to 15% of operations for a thriving company. More useful than any benchmark is your own trend: a falling COPQ percentage over several quarters shows the quality system is working.
No. Scrap rate counts defective units as a share of production. COPQ puts a dollar value on all failure costs, including rework, warranty, returns, downtime, and freight. A plant can have a low scrap rate and still have high COPQ if its defects escape to customers.
It works best as a joint process. Quality defines categories and assigns costs to defects. Finance validates the numbers and ties them to the general ledger. When quality reports COPQ alone, finance often questions the figures. When finance reports it alone, the defect detail needed for improvement gets lost.
Partly, if your contracts allow it. Most standard terms cover only replacement of nonconforming parts. To recover sorting labor, line-down costs, and premium freight, these must be written into the supply agreement before problems happen, with clear evidence requirements tied to your NCR records.
Monthly reporting with a rolling 12-month trend suits most manufacturers. Monthly figures can swing because of one large warranty claim or recall, so judge progress on the rolling trend rather than single months.
Yes. Invoicing errors, incorrect orders, rework in engineering documentation, and repeated customer service contacts are all failure costs. Manufacturers often find meaningful COPQ in order entry and documentation, not only on the shop floor.
Much of your COPQ starts at supplier sites long before parts reach your dock. AMREP places quality engineers and inspectors in key manufacturing regions, including Mexico, China, Vietnam, India, Thailand, Malaysia, and the Philippines, to stop defects where they are created. Our teams run source inspections, contain escapes, and lead supplier problems troubleshooting until root causes are closed. Contact AMREP to start reducing failure costs across your supply chain.
Contact Us To See What We Can Do
Call Us
Mon - Sat 9.00 - 18.00
Sunday Closed

12 - May 2025
12
May
2025
Malaysia is a premier manufacturing hub in Southeast Asia. According to the Malaysian Investment Development Authority (MIDA), “Malaysia, with its extensive trade....

22 - April 2025
22
April
2025
Healthcare is rapidly evolving, ensuring consistent and high-quality patient care. Total Quality Management (TQM) in healthcare is more than just a buzzword—it is a powerful....
16 - April 2025
16
April
2025
Total Quality Management (TQM) is a mindset that involves everyone in the organization working toward a common goal: achieving excellence through quality. From....


Our website uses cookies to improve your experience. Read our Cookie Policy for more information.