Guide to Qualifying New Suppliers in Malaysia for Manufacturing Success
Malaysia is a premier manufacturing hub in Southeast Asia. According to the Malaysian Investment Development Authority (MIDA), “Malaysia, with its extensive trade....

By AMREP | Posted on September 19, 2026
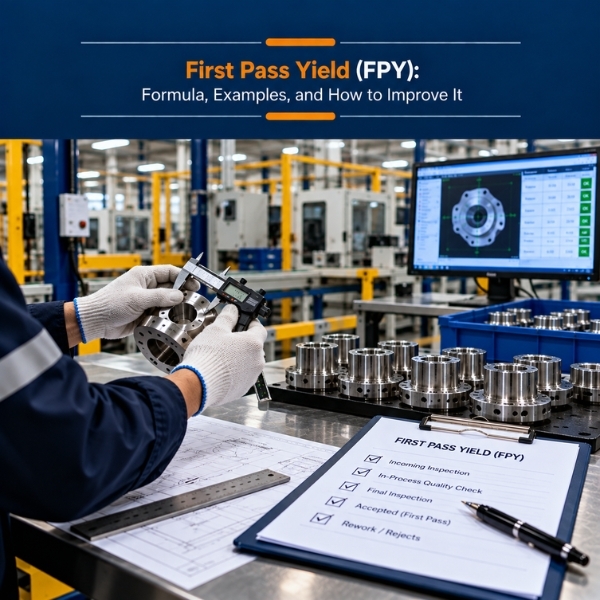
First pass yield (FPY) is the percentage of units that complete a process step correctly the first time, without rework, repair, retest, or scrap. The formula is simple: divide the number of units that pass the first time by the number of units that entered the step, then multiply by 100.
FPY matters because it exposes waste that other yield measures hide. A line can ship 99 percent good products while only 85 percent of units went through cleanly, with the difference absorbed by rework benches, retest stations, and overtime.
This guide covers the FPY formula, how it differs from final yield and rolled throughput yield, worked examples for single and multi-step processes, the data mistakes that inflate FPY, how standards treat it, and practical ways to improve it.
For a single process step:
FPY = (Units passing the first time / Units entering the step) x 100
"Passing the first time" means the unit met every requirement at that step without any of the following:
For a process with several steps, calculate FPY at each step and then multiply them together. The result is rolled throughput yield (RTY):
RTY = FPY step 1 x FPY step 2 x FPY step 3 x ... x FPY step n
RTY estimates the probability that a single unit passes through every step without being touched by rework. It is always lower than the lowest individual step FPY, which is why it reveals problems that step-level reports can miss.
Organizations use these terms inconsistently. Some use "first pass yield" and "first time yield" (FTY) interchangeably. Others use FTY for a single step and FPY for the whole process, which is what RTY measures. Before comparing numbers between plants or suppliers, confirm which definition each one uses and write it into your procedures.
FPY is one of several yield measures, and each one tells a different part of the story. The table below shows what each metric reveals and what it leaves out.
| Metric | Formula | What it tells you | What it hides |
|---|---|---|---|
| First pass yield (FPY) | First-time good units / units entering a step | How cleanly one step performs | Losses at other steps |
| Rolled throughput yield (RTY) | Product of all step FPYs | Probability a unit passes every step without rework | Which step is responsible, unless broken down |
| Final yield (traditional yield) | Good units out / units in, including reworked units | How much sellable output you get | The cost and time of rework |
| Scrap rate | Scrapped units / units in | Material loss | Rework that saved units |
| Defects per unit (DPU) | Total defects / units inspected | Defect density, including multiple defects per unit | Whether defects cluster on a few units |
| DPMO | Defects / (units x opportunities) x 1,000,000 | Defect rate normalized for complexity | Unit-level pass or fail experience |
Final yield is the number most often reported to management because it looks good. FPY and RTY are the numbers that describe how the process actually runs.
Quality pioneer Armand Feigenbaum called the resources spent finding and fixing defects the "hidden plant." FPY is one of the most direct ways to measure its size.
A machining cell processes 500 shafts in a shift.
FPY = 460 / 500 x 100 = 92.0%
Final yield = (460 + 30) / 500 x 100 = 98.0%
The 6 percentage point gap represents 30 shafts that consumed extra machine time, inspection time, and labor. Final yield reports them as good output. FPY reports them as process losses.
A product passes through three steps with these FPY values:
| Step | FPY |
|---|---|
| Stamping | 95.0% |
| Welding | 97.0% |
| Painting | 92.0% |
RTY = 0.95 x 0.97 x 0.92 = 0.848, or 84.8%
No single step falls below 92 percent, yet roughly 15 of every 100 units need rework somewhere in the process. That is the insight step-level reports alone rarely deliver.
When you track defects rather than pass or fail results, you can estimate RTY using the Poisson approximation:
RTY ≈ e^(-DPU)
If a process averages 0.20 defects per unit, RTY ≈ e^(-0.20) = 0.819, or about 81.9%. This method is useful for complex assemblies where one unit can carry several defects. It assumes defects occur randomly and independently, so treat the result as an estimate.
Each step's FPY should use the units that entered that step, not the units that started the whole process. If scrapped units at step 1 are counted in the denominator of step 2, step 2's FPY will look artificially low.
FPY is easy to calculate and easy to inflate. The most common problems come from how the data is collected, not from the formula.
Electronics lines often retest a failed unit without repairing it. If the second attempt passes, some test systems log the unit as a pass. That unit did not pass the first time. Count only the first test result for each serial number.
Frequent "retest and pass" results usually point to a measurement problem, such as poor fixture contact or marginal test limits, rather than a good product. Treating them as passes hides both the product issue and the test issue.
A unit that fails at painting, is sanded, and repainted should count as a first-pass failure at painting. It should not appear as a new unit entering painting.
Touch-up at the station, operator adjustments, and "quick fixes" that never reach a rework log all reduce true FPY. If they are not recorded, FPY will overstate performance. Standard defect codes at every station make this data collection possible.
Poor measurement systems also push FPY the other way. A gauge with high variation rejects good parts, which lowers FPY and triggers unnecessary rework. Confirm the measurement system is capable before acting on FPY trends.
FPY calculated from serialized data is far more reliable than FPY estimated from shift totals. Traceability lets you separate first attempts from repeat attempts and link failures to specific machines, operators, or material lots.
A low FPY rarely stays on the shop floor. Its effects show up in costs, delivery schedules, customer complaints, audit findings, and supplier relationships.
Every unit that fails first pass consumes extra labor, inspection, materials, floor space, and schedule time. Many of these costs sit outside the scrap line of the P&L, which is why they are easy to overlook.
Rework uses the same equipment and people as new production. A drop in FPY can cause missed shipments even when the final yield looks stable.
Reworked units carry more risk than first-pass units. Repair can introduce new defects, such as overheated solder joints or damaged coatings, and reworked units often receive less rigorous verification. Low FPY is an early warning of future customer complaints.
ISO 9001:2015 clause 9.1 requires organizations to monitor, measure, and analyze process performance, and clause 10.3 requires continual improvement. IATF 16949:2016 goes further. Clause 9.1.1.1 requires process studies and monitoring of manufacturing processes, and clause 8.7.1.4 requires documented rework instructions, confirmation of reworked product, and traceability of rework records. FPY is one of the clearest ways to show auditors that process performance is being tracked and improved.
FPY at supplier sites predicts delivery reliability and escape risk. Buyers increasingly ask key suppliers to report FPY by process step, with the counting rules defined in writing. Without shared definitions, supplier FPY reports are difficult to compare or trust.
Raising FPY starts with accurate data and moves step by step from finding the biggest losses to preventing them at the source. The ten actions below follow that order.
Before improving FPY, confirm the data. Apply the counting rules above, standardize defect codes, and collect results by step, shift, machine, and product. Improvement projects built on inflated FPY data often target the wrong problem.
Rank failures by defect type and step. In many processes, a few defect types account for most first-pass failures. Start with the step that has the lowest FPY or the highest rework cost, not the one that is easiest to fix.
Use structured tools such as 5 Whys, fishbone diagrams, and 8D. Ask why the defect occurred and why the process did not prevent or catch it. A Failure Mode and Effects Analysis helps prioritize failure modes by severity, occurrence, and detection before they reach production.
FPY falls when a process runs close to its specification limits. A process capability study shows whether the process can meet tolerances consistently. Where capability is low, reduce variation through better fixturing, tooling maintenance, parameter control, or material consistency. Monitor critical parameters using control charts in SPC so drift is corrected before it produces defects.
Poka-yoke devices prevent errors rather than detecting them after the fact. Examples include fixtures that accept a part in only one orientation, sensors that stop a press if a component is missing, and torque tools that lock out until the correct value is reached. Error-proofing is especially effective for assembly defects caused by missing or reversed components.
Many first-pass failures happen in the first units after a changeover, tool change, or material lot change. First-piece verification before running production, clear setup sheets, and locked recipe parameters reduce these losses.
Variation between operators and shifts often shows up clearly in FPY data. Standard work instructions with visual aids, skills matrices, and operator certification for critical tasks reduce this variation. Compare FPY by shift to see whether training gaps exist.
Defective or inconsistent purchased materials reduce FPY downstream. Work with suppliers on material specifications, incoming inspection, and corrective action for recurring issues.
Some FPY problems start in design. Tight tolerances that exceed process capability, parts that are difficult to orient, and features that cannot be inspected easily all reduce FPY. Feed recurring defect data back to design engineering.
Rework is one of the classic forms of waste in Lean thinking. Reviewing the 8 Lean Six Sigma wastes with your production team helps connect FPY losses with overproduction, waiting, and extra processing that rework creates.
The following is an illustrative example based on common patterns in electronics contract manufacturing. It is not a single client case.
An OEM sources printed circuit board assemblies from a contract manufacturer. The supplier reports 99 percent yield each month, yet the OEM's delivery schedule keeps slipping and field returns show solder-related failures.
A review of serialized test data by step, counting first results only, produced a different picture:
| Step | Reported yield | FPY (first result only) |
|---|---|---|
| SMT with AOI | 99.5% | 94.0% |
| In-circuit test (ICT) | 99.8% | 97.0% |
| Functional test (FCT) | 99.0% | 96.0% |
RTY = 0.94 x 0.97 x 0.96 = 0.875, or about 87.5%
Roughly one in eight boards needed rework or retest somewhere in the process. The reported numbers were final yields after rework and retest.
In this illustrative scenario, raising SMT FPY to 97.5 percent while holding the other steps constant lifts RTY to about 90.8 percent (0.975 x 0.97 x 0.96). That reduces rework volume, frees capacity, and removes a source of solder-related escapes. The larger gain is that the OEM now sees real process performance instead of a rework-adjusted number.
There is no universal target. FPY depends on product complexity, the number of process steps, and how strictly defects are defined. A simple molded part and a dense multilayer circuit board will not have comparable FPY. Set targets from your own baseline and customer requirements, then track improvement over time.
Not always. The OEE quality rate is usually good units divided by total units produced. Some plants count reworked units as good, which makes the quality rate closer to final yield. If you want the OEE quality rate to match FPY, define good units as first-pass good units only.
Yes. Scrapped units failed the first pass, so they count in the denominator and not in the numerator. Leaving them out inflates FPY.
Daily or per shift at the line level, so operators and supervisors can respond quickly. Weekly or monthly summaries by step and product work for management and supplier reviews. Very low volumes may need longer windows for the numbers to be meaningful.
Yes. The same logic applies to transactional processes such as order entry, invoicing, document approval, and software builds. Any process where work can be completed correctly the first time or sent back for correction can be measured this way.
AMREP Supplier Management Services has more than 35 years of experience helping OEMs see what really happens on their suppliers' production lines. Our engineers verify FPY data at the source, trace first-pass failures to root causes, and follow up on corrective actions at supplier sites across Mexico, China, Vietnam, India, Thailand, Malaysia, the Philippines, Indonesia, Poland, and the United States. Our supplier monitoring services give you production data you can trust, and our supplier quality engineering team works on site to raise yield. Contact the AMREP team to discuss your supplier base.
Contact Us To See What We Can Do
Call Us
Mon - Sat 9.00 - 18.00
Sunday Closed


12 - May 2025
12
May
2025
Malaysia is a premier manufacturing hub in Southeast Asia. According to the Malaysian Investment Development Authority (MIDA), “Malaysia, with its extensive trade....

22 - April 2025
22
April
2025
Healthcare is rapidly evolving, ensuring consistent and high-quality patient care. Total Quality Management (TQM) in healthcare is more than just a buzzword—it is a powerful....

16 - April 2025
16
April
2025
Total Quality Management (TQM) is a mindset that involves everyone in the organization working toward a common goal: achieving excellence through quality. From....


Our website uses cookies to improve your experience. Read our Cookie Policy for more information.